 How often should I send my email marketing campaigns, what’s the best practice for email frequency? It’s a common question and a very important one because email send frequency has a huge impact on overall performance.
The short answer is send 6.21 email campaigns per week, based on performance analysis of 199 million emails.
What’s more unless you’ve undertaken a review of email frequency as below you are almost certainly not contacting your subscribers with the right frequency.
How Email Frequency Impacts Read Rates
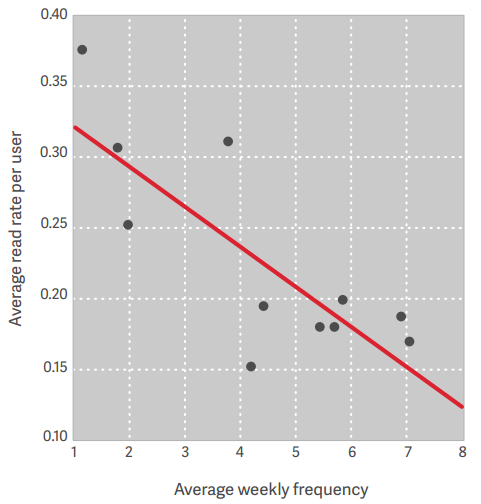
In a new post from ReturnPath the chart below was published. This is based on analysis of read rates for 199 million emails across 600,000 inboxes over a 3 month period.
There is no surprise that as frequency increases the read rate drops. The red line is the line of best fit, showing that a read rate of 30% when sending 2 emails per week halves to 15% when increasing to seven emails per week.
But that doesn’t automatically mean send 2 emails per week is better than seven. A strategy to maximize open rates alone is a fallacy.
Whilst the chart doesn’t answer the question of the best email frequency the answer is hidden in the chart data and I’ll uncover it now.

Turning the Chart Data on it’s Head
To get more business means sending more quality traffic to your website each week. This is no different for email than search, PPC or any other way of driving web traffic.
So it follows that the best strategy for send frequency is the email frequency that delivers the most email reads per week.
Optimizing for the most traffic is not the same as optimizing for the highest read rate.
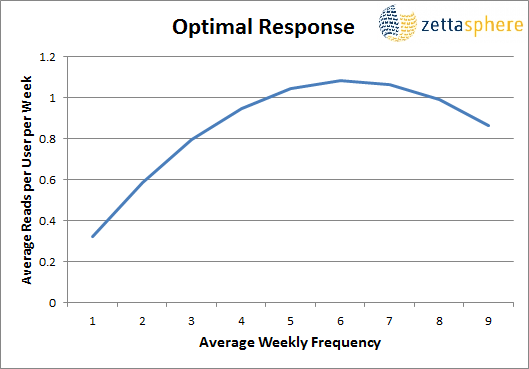
Consider on the chart that sending one email per week gives 0.32 emails read per user per week. Send four emails and the read rate for each email drops to 0.236, but because four emails were sent over the whole week the emails read increases to 4 x 0.236 = 0.94. Four emails per week gives more emails read than one email per week.
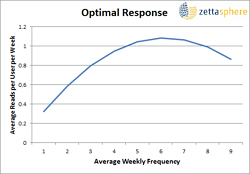
Transforming the data from the chart to plot the number of emails read per week on the vertical axis, rather than read rate, produces a totally different view.
And the best bit is that it shows a peak, the optimal number of emails to send per week.

The peak, the highest total response, occurs when sending 6.21 emails per week.
This is an average best from performance data for 8 major clothing retailers. If you are in fashion your best frequency may well be close to 6 emails per week. But different brands and verticals have different optimal values for how often to send.
The really good news is that there is a best send frequency for your brand and it is possible to determine it using the methods below.
Does the Theory stack up in Practice?
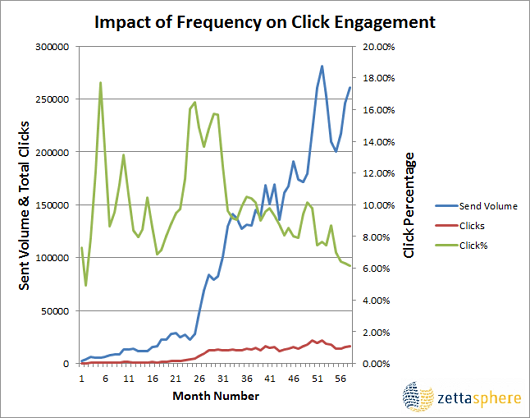
Just in case you are still dubious that high email volume can drive such success, here are the results from a significant frequency increase for one particular brand. This is real data and a significant volume increase tracked and measured right through the funnel.
The boost in email traffic to the eCommerce website from before to after the volume increase is a factor of 8.7. The revenue numbers were similarly impressive.

The blue line is the monthly email volume. The send frequency was increased significantly between months 28 to 30, as seen by the big jump up in the blue volume line.
The green line shows the click rate and this drops as volume increases. Increasing email frequency without improving content targeting invariably reduces campaign performance rates.
Finally the red line, the most important line, is the number of clicks per month, in other words the web traffic driven. An increase of 8.7 was measured.
No surprise this brand stayed with the increased email frequency.
Send 6.21 Emails per Week, really?
The ReturnPath chart was based on email campaigns from eight major clothing retailers. If you’re a fashion brand then very possibly the optimum send frequency is as high as 6 emails per week.
Other verticals and brands may find their optimum frequency is different. Factors that impact the right frequency include type of product, audience demographic, data collection source and even the expectation set during the signup process. If someone has signed up for daily tips/news/deals, then sending 7 emails per week is fine.
The ReturnPath data also showed that the subscriber complaint rates increase rapidly after a frequency of five emails per week. Pushing much beyond five emails per week may damage inbox placement and long term success.
How Often You Should Send Email
Basing any strategy on averages from other brands is not best practice and certainly won’t give the best possible result.
The key point is that there is an optimal send frequency for your brand and it’s highly beneficial to determine exactly what that is.
Work out the frequency through this testing and data analysis process.
Testing Frequency Increase
Run a frequency split test. Split your list into two or three and send at a different frequency to each test group.
For example, if you are sending two emails per week then run a split with three groups:
- The control with two emails per week
- A test group with one per week
- A third test group with three emails per week
For each test group track:
- Campaign average open and click rates
- Gross number of clicks
- Web sessions created
- Web conversion rate
- Total revenue
- Number of unsubscribers
At the end of the test review which group generated the highest revenue. Make allowance for additional campaign costs, such as extra creatives and send volume and then decide on which frequency is best for profit.
Make sure you:
- Run the test for 8 to 12 weeks or longer if your frequency is below once per week
- Ensure new subscribers are not added to any of the test groups
- Use a split test calculator to ensure valid results. You’ll need test groups of 10,000+ subscribers each.
Calculate the Optimal Email Frequency
After running the test above use the data from each of the test groups to determine the optimal frequency. Or if you’ve been sending to your database with varying frequency you may have the data you need already.
Plot the click rate against send frequency and find the trend line, as in the ReturnPath chart above.
Then transform the equation describing the trend line, to show gross clicks against frequency. You should see a curve with a peak, your perfect send frequency found.
If you don’t have someone who can do the maths for you then ask me. Send me your trend line and I’ll work it out your optimal frequency for free.
Hang on, won’t I get lots of unsubscribes?
Increasing frequency doesn’t increase the unsubscribe rate but it will increase the number of unsubscribers per month.
But keep in mind the additional revenue. It’s unusual for the value in lost subscribers to be greater than the gain in additional revenue.
