 Just because you are using AI doesn’t mean you’re getting the best possible results in your email marketing. This in depth browse abandonment email case study illustrates.
Two different sets of computer generated recommendations were pitted against each other in an A/B split test and a 20.5% revenue increase delivered.
The use of recommendation engines of various kinds has been growing rapidly to improve the relevance of email content.
It’s the only practical way to do personalisation at scale, particularly when the brand offer includes a large or diverse range of products.
Browse abandonment email delivers 8.5% of email revenue
A muscle car restoration parts specialist was already at 8.5% of all email channel revenue from browse abandonment emails using technology from Fresh Relevance.
The revenue per email (RPE) for browse abandon being a healthy 293% higher than their average marketing email.
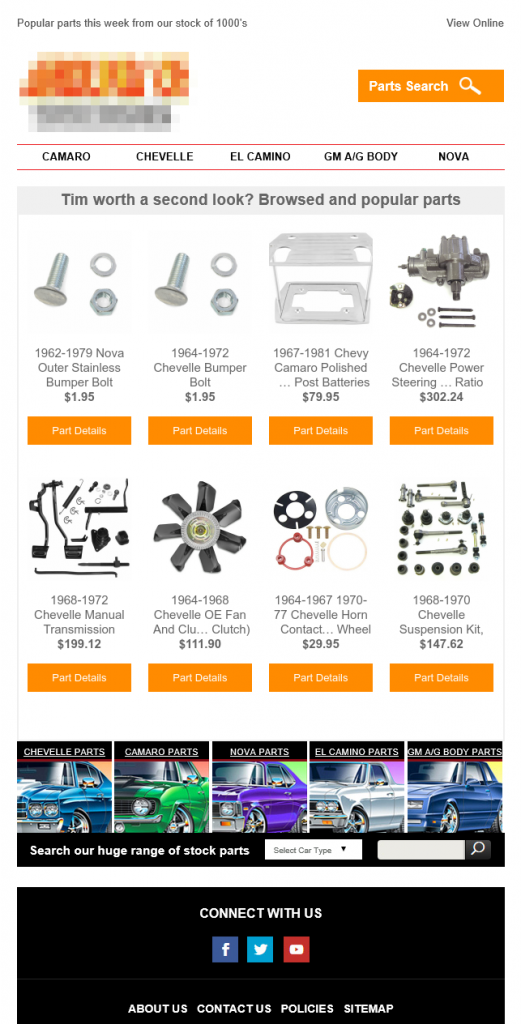
The browse abandon email, shown below, features a grid of dynamically inserted products. These are based on products browsed by the site visitor plus further products based on what all site visitors are browsing.

Human against machine
The browse abandonment email was making a good revenue contribution, but could it be improved?
After human review of the product recommendations it was felt the machine didn’t always hit it out of the park with picking the best product to show. The human choice for the best parts to show, based on items browsed, was different.
Was the human expert right or did the machine have deeper insight?
I began a review with Fresh Relevance. This identified the data being used as part of the issue. The product meta-data wasn’t giving the machine the best chance to pick the right products.
Garbage in, garbage out, a computer expression first coined in 1957, is as relevant to today’s super sophisticated machine intelligence as it was in 1957 to the US Army.
Put simply, no machine can make up for sub-optimal input data.
Fresh Relevance did a great job of finding a method to improve the data without needing to manually edit meta data for 10,000’s of SKUs. Phew.
Spot on recommendations would drive higher product clicks, right?
But it’s not quite what happened.
Testing the machine
Split testing isn’t just for testing human opinion. It’s valid for testing different approaches to computer generated content too.
The original browse abandon email and new treatment email were tested against each other in a traditional A/B type split test.
The test hypothesis; the improved meta-data with an email showing browsed products and products based on what other visitors purchased, would increase the click rate because of increased relevance.
The treatment email was otherwise identical to the control. Just the method of generating the products in the grid was changed.
As with all split tests, enough data is needed to get statistically sound results. The sample size for the test was 37,500 emails and results validated using an online split test calculator.
A shock but not all bad
It didn’t quite go as expected, but that’s the whole point to testing.
Here’s the summary results:
- Open rate: No change from control to treatment
- Click rate: 43.3% lower total click rate
- Conversion rate: 91.8% higher conversion rate
- Revenue: 20.5% increase in revenue
Yes, you read that right, the total click rate went down 43% and unique click rate down 23.7%. The improved product relevance gave fewer email clicks.
Drilling down on results
Whether a test result is an increase or decrease, drill down further to get more insight.
Whilst the treatment had a 23.7% lower unique click rate, the total click rate dropped even more, 43%.
Where did the extra clicks come from in the control email? The product grid or the navigation and other links in the email?
The product grid clicks on the control email were 211% higher than the treatment product grid. Just about all the difference in click rate was due to the control getting more product clicks.
People clicking from the control email product grid also explored 3.7 pages on the website vs 2.9 from the treatment product clicks.
A new hypothesis
What would cause the treatment email, with expected higher product relevance, to show decreased clicks, decreased total clicks and decreased webpage browsing, yet higher revenue?
The new hypothesis is the control email is leading to curiosity and misguided clicks. Poorly qualified click traffic and very possibly customer frustration as they click and browse trying to find what they really wanted.
Whereas the treatment was doing its job. It’s better at showing the products that get the conversion and doesn’t waste the customer’s time trying to find the right product.
Lower clicks, higher qualified traffic, more revenue.
Wrapping it up
I’ve already got ideas on what to try next, it’s common for one split test to lead to several more.
Whether you’ve got automated marketing emails already or are intending to start using automated content, here’s what you can learn from these results:
- Just because a computer made the decision, doesn’t make it right. Split testing the method used for automated content can boost results
- Sometimes the winner has a lower click rate. When testing measure revenue conversion too
- Check split test results for statistical significance
- Dig deeper into results, whether they are good or bad. There is more to learn
- High quality meta-data on which to base recommendations is fundamental
Perhaps in the future we’ll see AI systems automatically creating and split testing the systems own assumptions!
