

There have been a couple of heated debates I’ve been part of in the email community just recently, one about open rates and another about subject line length. In this post I’m reflecting on the open rate debate. I’ve added an update to the original post showing more proof that open rate fixation can be misleading.
It may surprise you that the community is very split on the value of the open rate metric, seemingly, a cornerstone metric since the dawn of email marketing. It’s a metric cited in every email marketing book and on every mail marketing course… So why is its value in doubt?
Let me summarise some of the reasons why open rates are not important.
- Opens are almost never the objective of a campaign. Possible exceptions might be in publishing and list hygiene, when identifying active addresses to solve deliverability problems.
- Higher open rates do not always mean higher click and conversion rates. Open and click/conversion can and do go in opposite directions. Why bother with open rate when you can focus on click or conversion?
- Open rates can be misleading. Through focusing on driving higher open rates this can potentially leave you with less business.
I’ve recently undertook research into whether open rates are a good predictor of success in email marketing. The data came from across 50 million retail emails and 196 campaigns. The headline finding is…
Open rates wrongly predict success 53% of the time
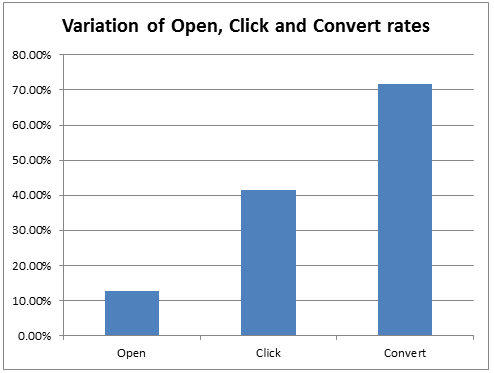
As you might expect, there is a much closer correlation between clickthrough rate and open rate. This graph from the research shows that the open rate is relatively unchanging; it typically varies by just 12%. So if the open rate average is 20% that means it varies up to 22.4%. However conversion rates vary hugely in comparison, by some 70%. If average conversion rate is 0.2% then it varies up to 0.34%. To understand campaign performance the conversion rate is a must.
Why can a higher open rate mislead and deliver less business? Take an example, I talked to someone recently who was delighted they had increased their open and click rates. I asked how. The answer was they removed people who hadn’t opened recently. I asked if they had conversion and revenue figures to compare. I wasn’t surprised when I didn’t get an answer…
The five different cases below illustrate many of the problems with open rates.
Case 1 – List hygiene and inactives
List size 10,000
Number of people who open 2,000
Open rate 20%
A common percentage of inactives is 40% of the base. Let’s remove those 4000 people from campaigns.
List size 6,000
Number of people who open 2,000
Open rate 33%
That’s a 50%+ increase in open rate. Will it have resulted in 50% more revenue? Absolutely not. In fact most likely the revenue will decrease, because every month a percentage of the apparently inactive customers do come back again.
The open rate metric and increase in this case does not represent business success.
Case 2 – Monthly reporting and averages
Campaign open rates are sometimes averaged over the month for reporting. For example these three campaigns:
Campaign A 60%
Campaign B 20%
Campaign C 10%
This gives the monthly open rate, calculated as the average of open rates, of 30% = (60+20+10)/3.
Let’s add real numbers to the above figures
| Delivered | Opened | Open rate | ||
| Campaign A | 1000 | 600 | 60% | |
| Campaign B | 2000 | 400 | 20% | |
| Campaign C | 6000 | 600 | 10% |
Total emails sent 10,000 with total opens 1600, giving an open rate over all campaigns of 16%. The commonly used average of opens, at 30%, is almost double the real value.
Case 3 – Same rates, but one campaign is better
Two campaigns with identical open rates. Which campaign was more successful? Ok, so you’re getting wise and want to know the send size before you decide? That’s fair, here are more campaign metrics.
| Delivered | Open rate | Click rate | Conversion rate | |
| Campaign X | 10000 | 15% | 5% | 0.25% |
| Campaign Y | 10000 | 15% | 5% | 0.25% |
They still look the same. However, campaign Y is more successful. Because the average order value for campaign Y was double that of Campaign X.
Case 4 – The impact of frequency variation on open and click rate
Customer segment A receives a campaign with open rate 20% and click rate 5%.
Customer segment B receive two campaigns in the same period and because of email increased marketing pressure the open rate drops to 15% and click rate to 4%.
Which was more successful?
If the list size is 10,000, then the number of opens for segment A was 2000 and for segment B was 3000 across the two campaigns. Making campaigns to segment B more successful, although the campaign open rate is lower.
Case 5 – Subject line A/B split tests
Surely the open rate is a useful measure of the subject line quality?
Well, not really here either. Take the case where one subject line gets lower opens and higher clicks than the other. The better subject line is the one with higher clicks and lower open rate. Fewer people may have opened but the ones that did open were the right ones, the right target for the offer and call to action.
It would be even better to evaluate the subject line on conversions, however test cell sample sizes don’t normally permit that.
If not open rate then what?
To sum it up, the better metrics to focus on are:
- Total revenue from email
- Revenue per 1000 emails sent (customers) per campaign
- Email revenue per customer per month
- Average customer order value
- Conversion rate
- List size and growth
- Percentage of email base purchased in the last month
- Percentage of email base clicked/opened in the last month
Notice how these metrics consider money and customers not campaigns. Measure campaigns to understand what campaigning strategies work and measure customers too, as customers are more fundamental to business health.
What other metrics, whether new ones or old ones should have time called on them?
Acknowledgement: I originally posted this article on SmartInsights