
How do you decide on the test cell sample size for email splits tests? I’ve often seen discussion about it being important to get right, but seldom seen information on how to do that. If you’ve been waiting for an answer on how to pick test cell size then this post is for you. By the end of this post you will know how to decide on your test cell size
Sample sizes are all about statistics; fear not, you’ll get the information you need here with some simple look up tables. Or if you prefer use this online split test calculator.
Let me start with an example of an A/B test using a sample size of 100. With a result of test cell A giving a 5% click rate and test cell B 6% then logically B is the winner. The relative uplift of B on A is 20%. That is a 1% increase on 5%, giving increase 1/5 = 20%.
Sounds great? With the sample size of 100, test cell A 5% click rate means 5 people clicked and in cell B 6 people clicked. Just one person difference. If just one person had gone the other way there would have been no difference between cell A and cell B, no winner, no 20% increase.
The result is termed not statistically significant. This means that the difference between the test cells is due to random variation and not because of a true difference in the effectiveness of getting the click.
Clearly jumping to a conclusion based on one person difference is totally unreliable. Of course a larger test cell is needed. But how much larger, should it be? 200, 300, 4000?
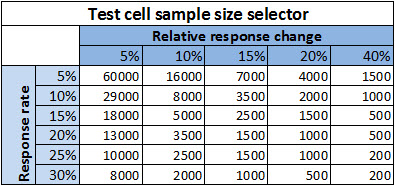
Help is on hand to allow you to decide your test cell sample size by using this simple table.
To use the table you need to know just two things:
- What is your normal response rate?
- What is the smallest difference you want to measure?
Your normal response rate
This is simply the normal click through rate you expect. If this is the first time for the type of campaign being tested then make an educated guess based on your other campaigns. Guessing on the low side will play safe with sample size.
Smallest difference to measure
The size of the difference in response between test cells affects how big the test cells need to be. You must trade off test cell size against the smallest difference in response that you want to know is a true difference, a difference that is statistically significant.
To help answer this question think about the level of bottom line improvement worth testing for and the cost of doing the testing. Typically its not worth trying to measure less than a 10% difference, for example, less than an increase of 5% to 5.5% is not interesting.
As data is a precious resource using the smallest possible test cell means more test cells and more tests. Running more tests searching for a 10% or 20% increase is better than one large test cell that allows a 1% increase to be measured with statistical significance.

Using the table
Let’s say our normal click rate is 10%. In the test we want to measure if the click rate changes by 20% or more. That is if it increases from 10% to 12% or more. First look down the left hand table column and find 10%, then look across to the column for 20%. This gives the answer that the sample size needed for each test cell is 2000. With this sample size you can be confident that any click rate change of 20% or more is a statistically significant result and not just randomness.
I’ve used click rate as the optimisation response metric throughout this post. The table and the same concept applies whether for open rate, click to open rate or conversion rate. You can plug those alternatives into the same table. Just remember if you use a click to open rate your sample size will be smaller. The sample in this case is the number of people who opened, not the number of people to whom you delivered.
Which metric you should use depends on the metric that best represents your marketing objective. Hint, that’s unlikely to be your open rate.
Should there be any students of statistics reading, you may wish to know the table above is based on a confidence level of 95%.
I hope that you are now better equipped and know better next time you hear someone saying ‘just use 10% of your list to test’.
Don’t forget that you can use our split test significance calculator as an alternative to the above tables.